
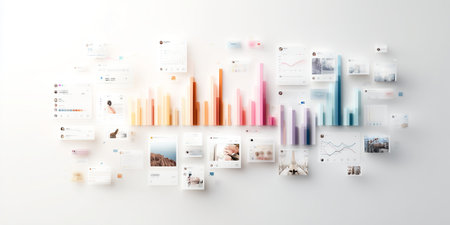
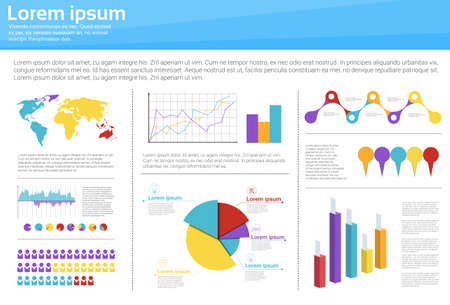
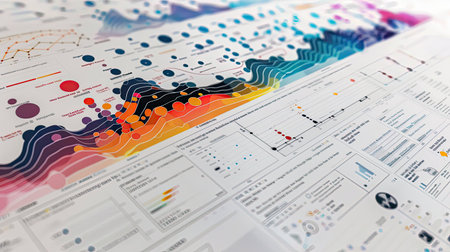
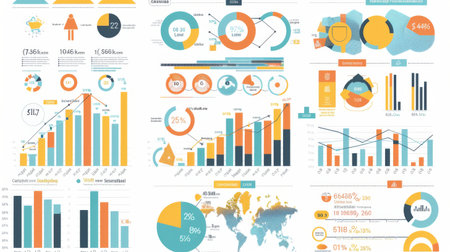
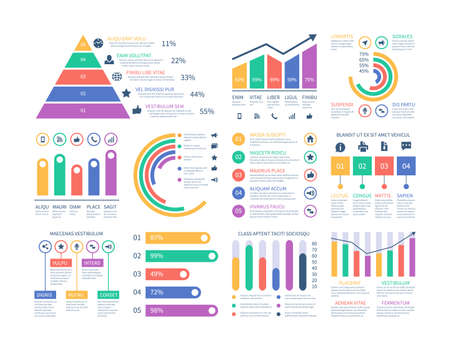
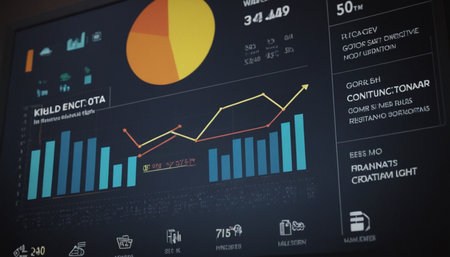
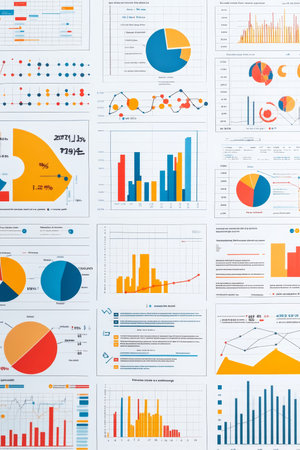
Data visualization showing trends and user interaction metrics over time in digital format
Коллекция по умолчанию
Коллекция по умолчанию
Создать новую
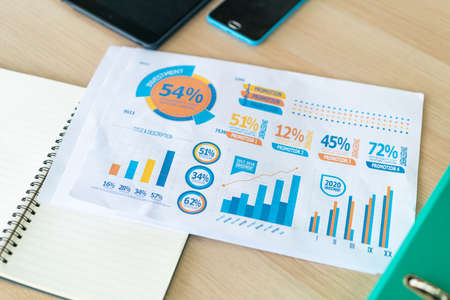
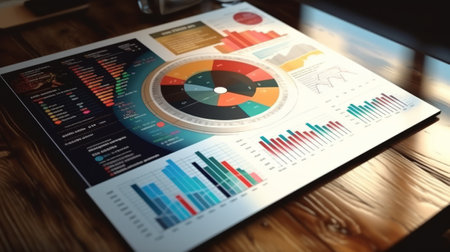
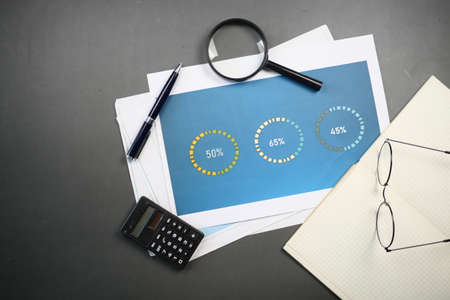
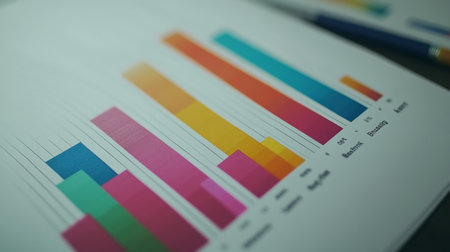
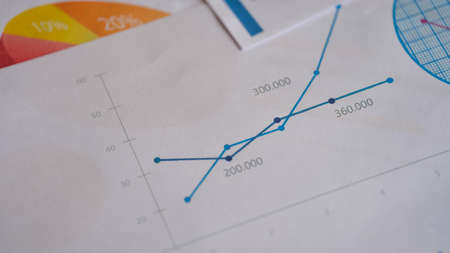
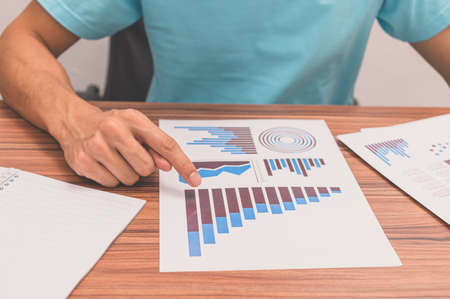
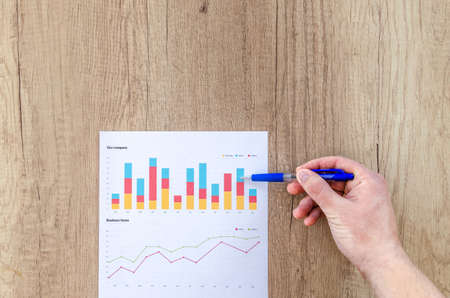
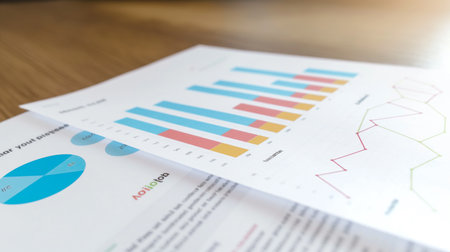
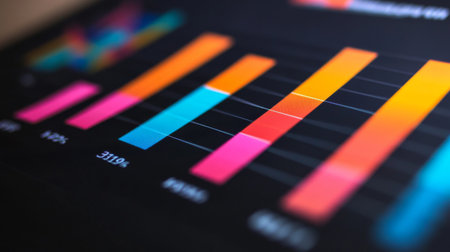
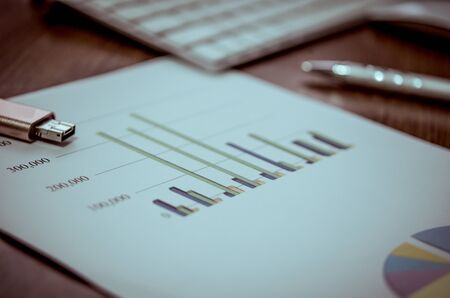
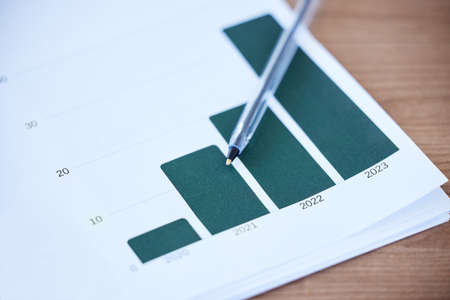
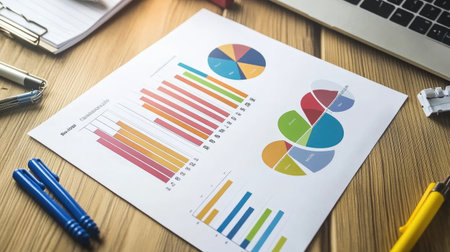
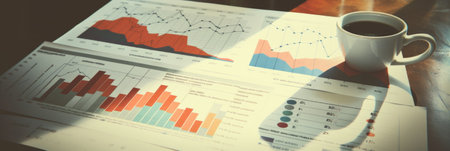
close-up business graph paper on working table
Коллекция по умолчанию
Коллекция по умолчанию
Создать новую
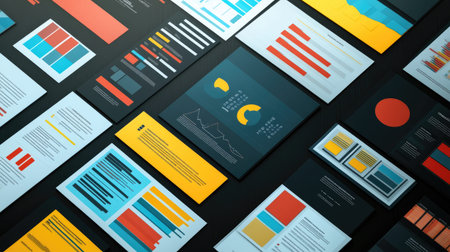
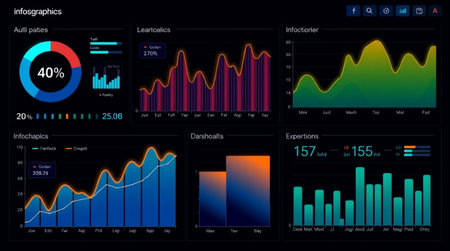
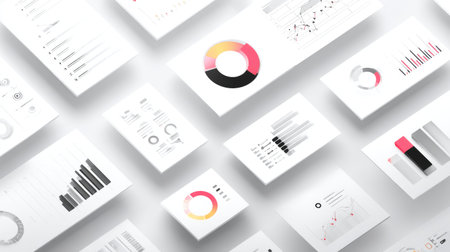
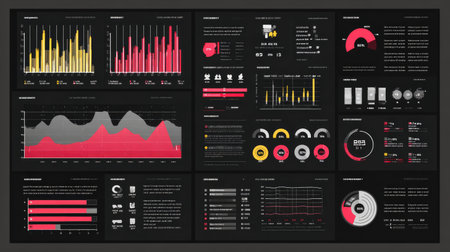
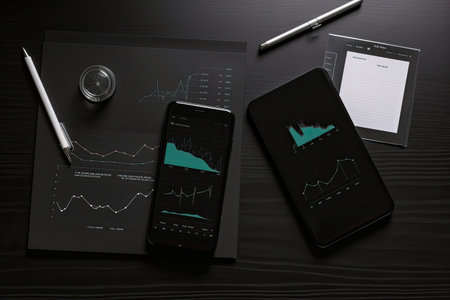
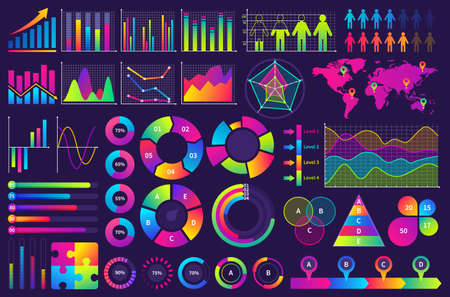
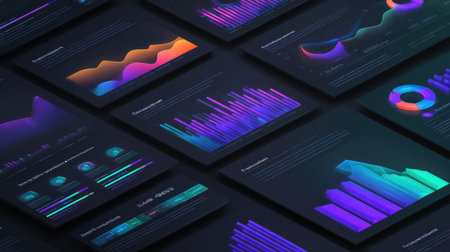
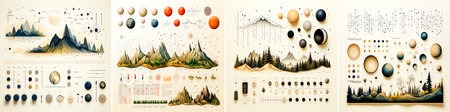
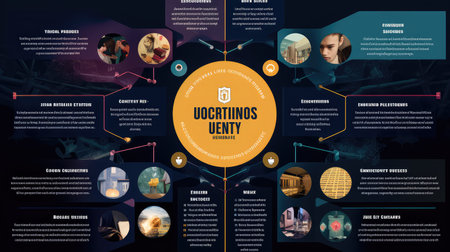
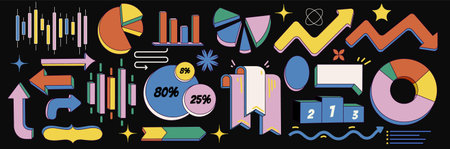
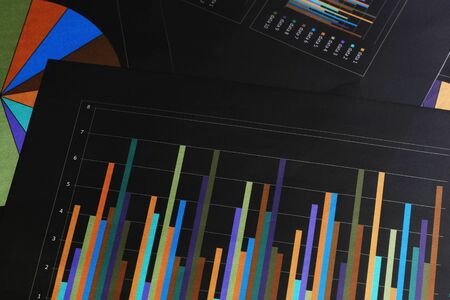
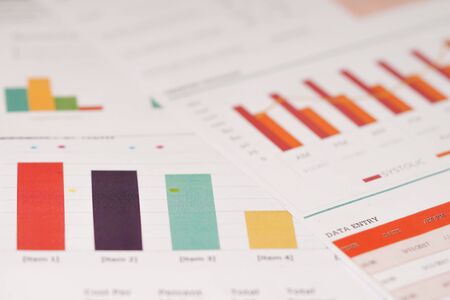
This image features a vibrant collection of modern graphic templates arranged creatively on a dark background. Ideal for artists seeking inspiration in design.
Коллекция по умолчанию
Коллекция по умолчанию
Создать новую
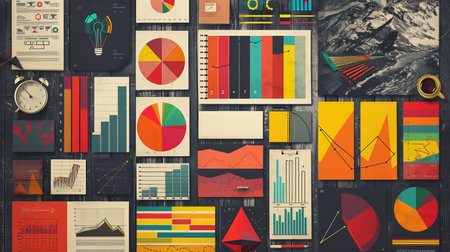
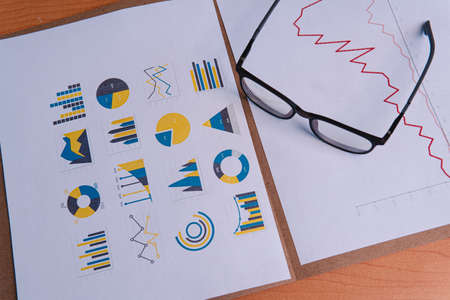
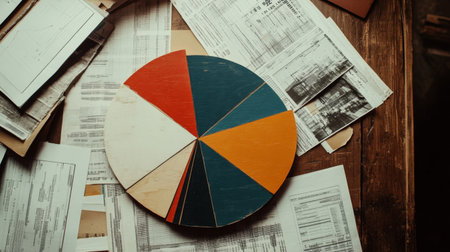
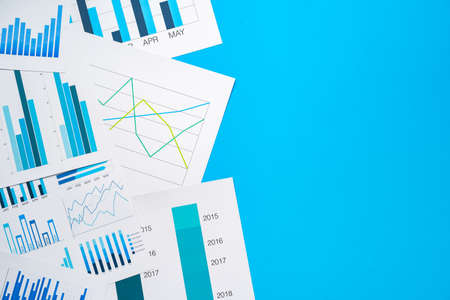
Collage background visual of various business scenes. Management strategy.
Коллекция по умолчанию
Коллекция по умолчанию
Создать новую
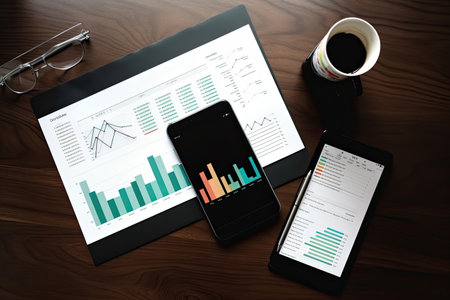
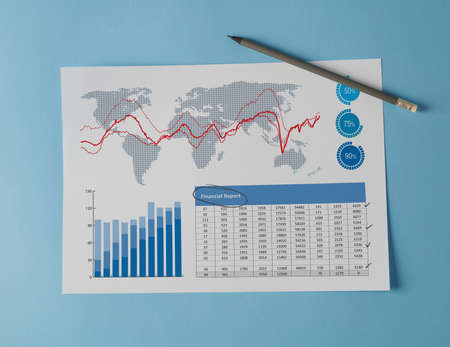
Smartphone and Tablet pc with financial charts and graphs on office desk, business concept
Коллекция по умолчанию
Коллекция по умолчанию
Создать новую
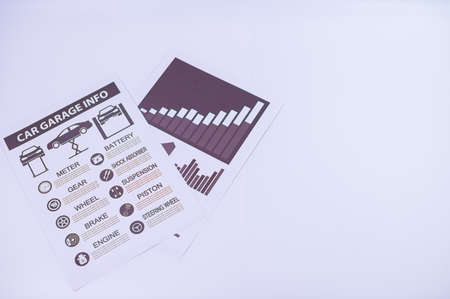
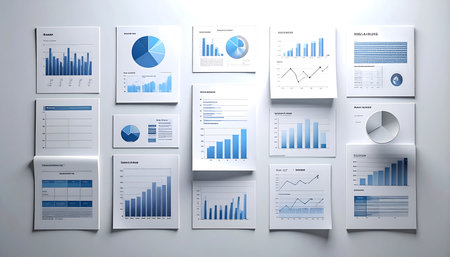
Business document paper placed on a white scene
Коллекция по умолчанию
Коллекция по умолчанию
Создать новую
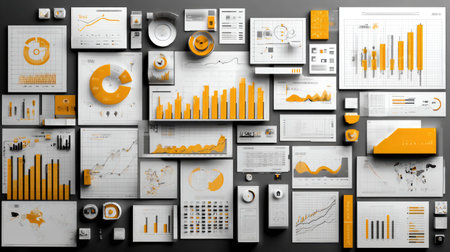
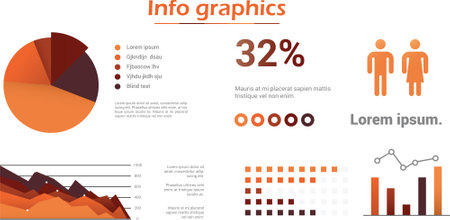
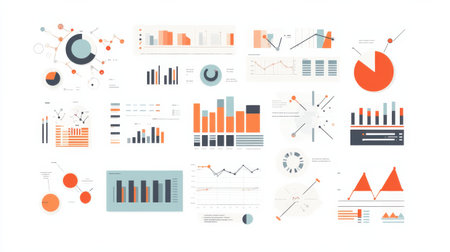
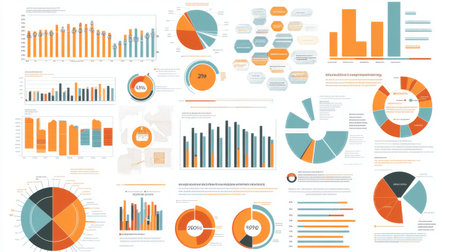
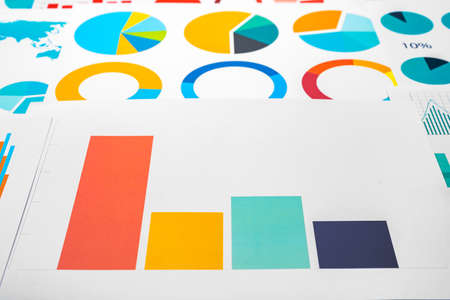
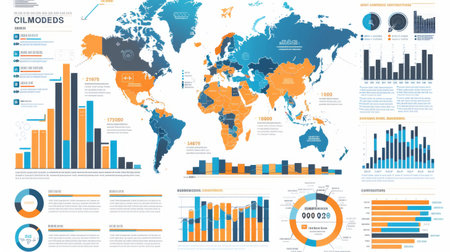
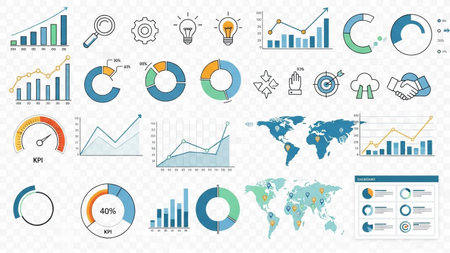
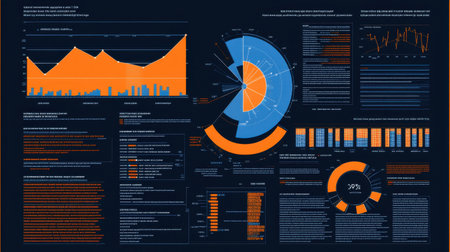
Discover a vibrant collection of data visualization elements featuring graphs, charts, and diagrams in orange and white, perfect for business analytics and professional reports.
Коллекция по умолчанию
Коллекция по умолчанию
Создать новую

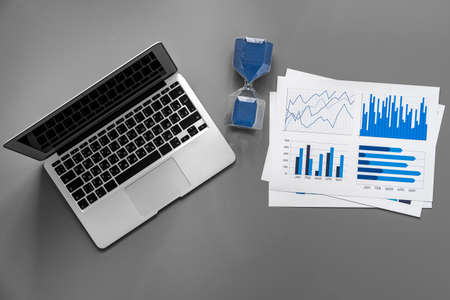
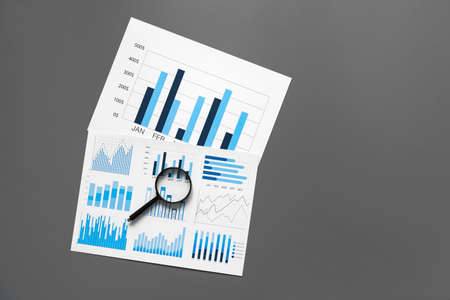
Printed graphs and laptop on dark gray surface
Коллекция по умолчанию
Коллекция по умолчанию
Создать новую
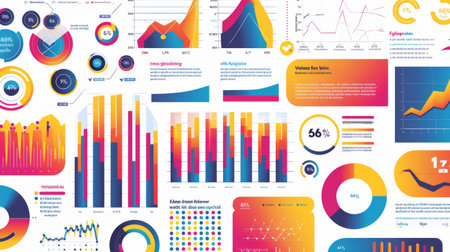
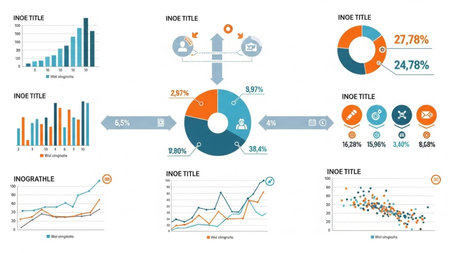
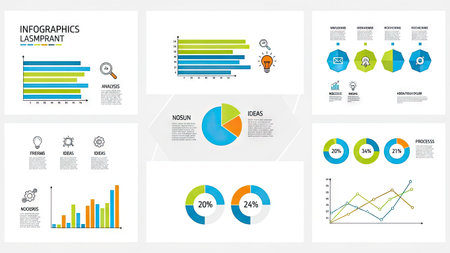
A vibrant infographic with various graphs and data points, representing statistical information clearly.
Коллекция по умолчанию
Коллекция по умолчанию
Создать новую
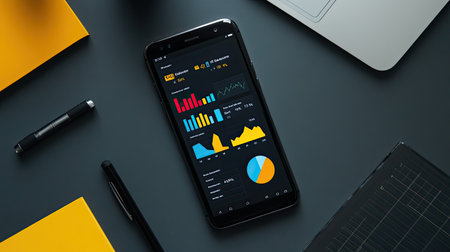
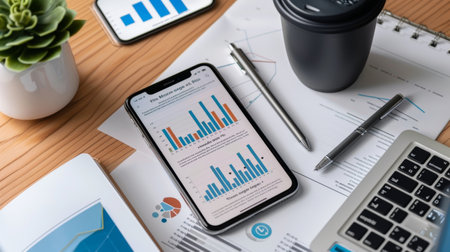
A flat lay of a smartphone with digital graphs and charts on the screen, with ample copy space.
Коллекция по умолчанию
Коллекция по умолчанию
Создать новую
Business data analysis with charts. Generative AI
Коллекция по умолчанию
Коллекция по умолчанию
Создать новую
Set of infographics with diverse diagrams and formulas on a white background
Коллекция по умолчанию
Коллекция по умолчанию
Создать новую

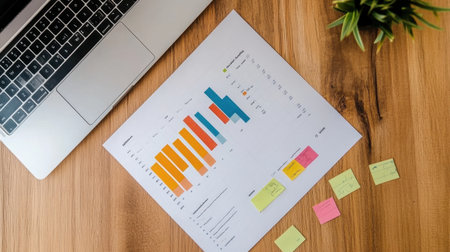
Flat lay of marketing plan documents, colorful sticky notes, and pie charts in creative workspace
Коллекция по умолчанию
Коллекция по умолчанию
Создать новую
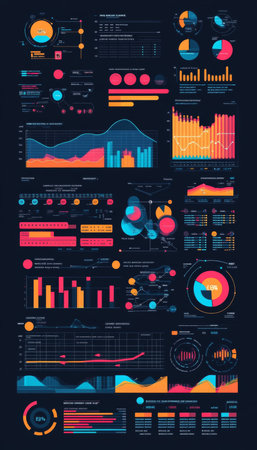
Financial Infographic Vector Graphs, Charts, and Data Visualization Elements on a Dark Background
Коллекция по умолчанию
Коллекция по умолчанию
Создать новую
Graph Set Finance Diagram Infographic Icon Financial Business Chart Flat Vector Illustration
Коллекция по умолчанию
Коллекция по умолчанию
Создать новую

Modern office workplace with laptop computer mockup, tablet pc and smartphone on the office desk. There is a laptop, tablet computer, smartphone on the table. For design presentation or portfolio.
Коллекция по умолчанию
Коллекция по умолчанию
Создать новую
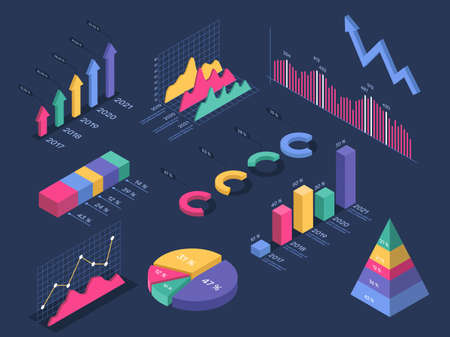
Isometric infographics. Pie chart, circle graph, histogram, pyramid diagram, growth progress bar. 3d infographic charts for presentation vector set. Data icons for business plan analytics
Коллекция по умолчанию
Коллекция по умолчанию
Создать новую

Person in a casual plaid shirt holding a printed data analysis report with bar charts and graphs, standing in front of a wall covered with business analytics charts.
Коллекция по умолчанию
Коллекция по умолчанию
Создать новую
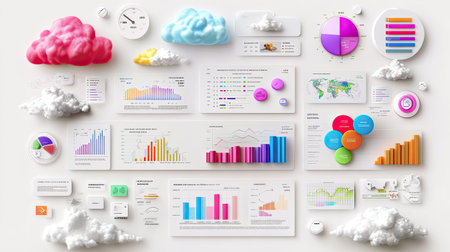
Engaging and colorful data visualization showcase with charts, graphs, and cloud graphics, perfect for business presentations and digital reports.
Коллекция по умолчанию
Коллекция по умолчанию
Создать новую
Big set of infographics elements. Infographics for business presentations or information banner.
Коллекция по умолчанию
Коллекция по умолчанию
Создать новую
Various data visuals are displayed, including bar graphs, line charts, and pie charts showing trends and statistics across different categories and metrics.
Коллекция по умолчанию
Коллекция по умолчанию
Создать новую

reports and histograms on paper on the table, analytics and statistics on paper, business analytics
Коллекция по умолчанию
Коллекция по умолчанию
Создать новую
financial graph, calculator and notepad on table
Коллекция по умолчанию
Коллекция по умолчанию
Создать новую

Strategic Insights: A Wooden Canvas of Business Growth Analytics
Коллекция по умолчанию
Коллекция по умолчанию
Создать новую
Business themed presentation templates. Background with papers full of graphs and executive glasses. Folder with papers full of graphs and glasses on a table. High quality photo
Коллекция по умолчанию
Коллекция по умолчанию
Создать новую
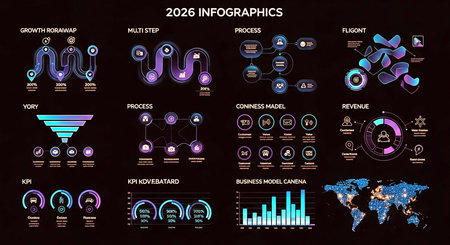
Futuristic infographics design elements for business presentations, annual reports and web design.
Коллекция по умолчанию
Коллекция по умолчанию
Создать новую
An infographic-style financial graph with pie charts, bar graphs, and line charts, designed for a professional presentation or report.
Коллекция по умолчанию
Коллекция по умолчанию
Создать новую
Image of statistics recording and covid 19 cells over man drawing in office wearing face mask. global covid 19 pandemic, health and medicine concept digitally generated image.
Коллекция по умолчанию
Коллекция по умолчанию
Создать новую
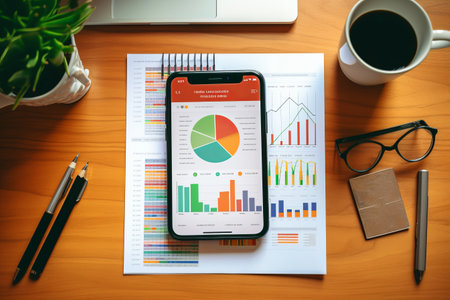
A neatly arranged desk with a smartphone displaying data charts, surrounded by office supplies, symbolizing productivity, finance, and business analysis.
Коллекция по умолчанию
Коллекция по умолчанию
Создать новую
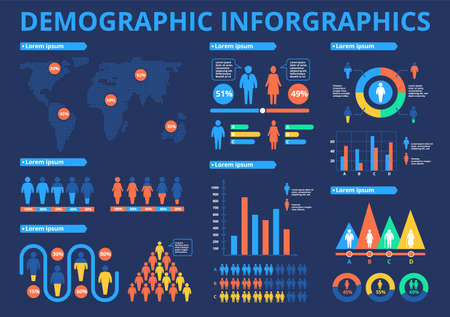
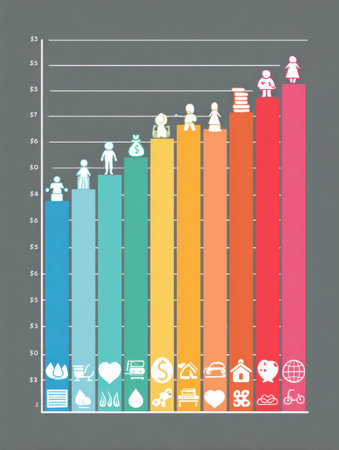
Demographics infographic. World map population statistic with data charts, graphs, diagrams, people icons. Human infographics Vector brochure. Young and old, female and male human beings
Коллекция по умолчанию
Коллекция по умолчанию
Создать новую
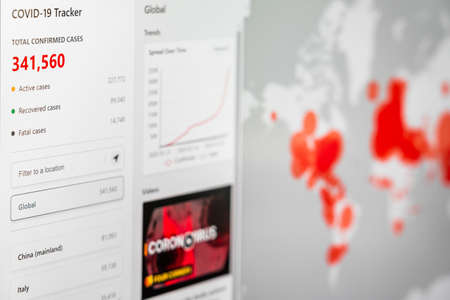
BUCHAREST, ROMANIA - MARCH 23, 2020: Coronavirus Total Cases Of The Pandemic Spreading All Around The Globe In March
Коллекция по умолчанию
Коллекция по умолчанию
Создать новую
This image features a diverse collection of modern data visualization charts and graphs, ideal for business reports and marketing presentations in a clean layout.
Коллекция по умолчанию
Коллекция по умолчанию
Создать новую
A project management infographic tracking milestones and timelines with progress bars and completion percentages.
Коллекция по умолчанию
Коллекция по умолчанию
Создать новую
This image is a collection of various data visualization charts including bar graphs, pie charts, and scatter plots. Each chart provides different types of data representation, such as categorical data distribution, percentage breakdowns, and trends over time.
Коллекция по умолчанию
Коллекция по умолчанию
Создать новую
A neatly arranged workspace features a colorful bar graph analysis on paper, sticky notes scattered around, and a laptop on a wooden table, symbolizing productivity.
Коллекция по умолчанию
Коллекция по умолчанию
Создать новую
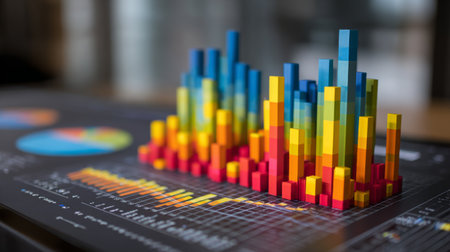
Vibrant 3D bar chart sits on a digital workspace, showcasing data analysis. The image represents growth, trends, and technology in modern business presentations.
Коллекция по умолчанию
Коллекция по умолчанию
Создать новую
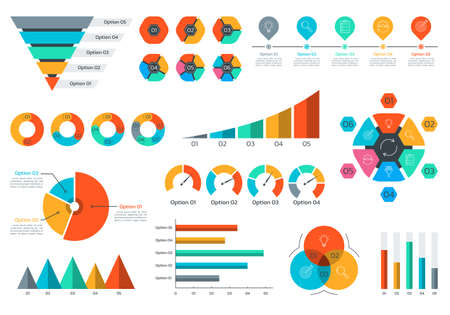
Chart and graph set. Business data infographic elements with circle diagram, pie chart, funnel, timeline infographics. Vector illustration.
Коллекция по умолчанию
Коллекция по умолчанию
Создать новую
Infographic design template with place for your data. Vector illustration.
Коллекция по умолчанию
Коллекция по умолчанию
Создать новую

An infographic-style image displaying a vibrant D bar chart alongside various data points, with arrows and percentages, illustrating the impact of marketing strategies on company growth.
Коллекция по умолчанию
Коллекция по умолчанию
Создать новую
hazard risk chart
Коллекция по умолчанию
Коллекция по умолчанию
Создать новую

Glasses and phone lie on a black background next to a gray notepad and a sheet with a schedule
Коллекция по умолчанию
Коллекция по умолчанию
Создать новую
This image showcases a colorful bar graph that visualizes data insights for business analysis. The vibrant colors highlight various metrics and trends.
Коллекция по умолчанию
Коллекция по умолчанию
Создать новую
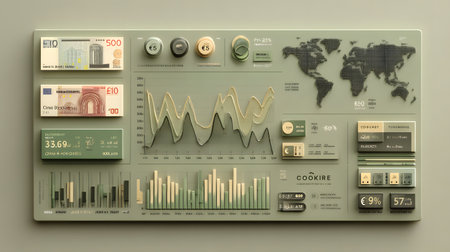
Explore a creative financial data visualization featuring currency notes and detailed charts. Ideal for finance, business, or educational projects.
Коллекция по умолчанию
Коллекция по умолчанию
Создать новую
Close up of business graph analysis document
Коллекция по умолчанию
Коллекция по умолчанию
Создать новую

A visually striking D bar graph displaying comparative data, with layered bars in different colors, creating a sense of depth and complexity in financial analysis.
Коллекция по умолчанию
Коллекция по умолчанию
Создать новую
A business presentation slide featuring an infographic on consumer behavior trends and market analysis.
Коллекция по умолчанию
Коллекция по умолчанию
Создать новую
Printed graphs and laptop on dark gray surface
Коллекция по умолчанию
Коллекция по умолчанию
Создать новую
Documents with colourful charts, graphs and diagrams
Коллекция по умолчанию
Коллекция по умолчанию
Создать новую
Engaging data visualization dashboard showcasing various graphs, charts, and infographics designed for effective business analysis and performance tracking.
Коллекция по умолчанию
Коллекция по умолчанию
Создать новую
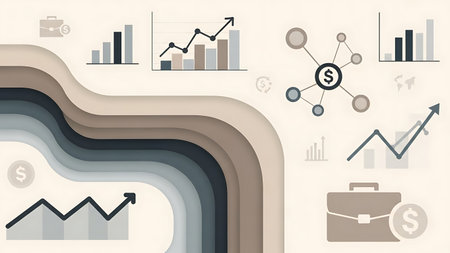
Illustration of financial growth with rising charts, global investment networks, profit symbols, and business success indicators. Ideal for finance, stock market, and economic growth concepts.
Коллекция по умолчанию
Коллекция по умолчанию
Создать новую

A vibrant workspace scene featuring financial documents, a coffee cup, and lush green plants on a rustic wooden table, perfect for showcasing productivity and organization.
Коллекция по умолчанию
Коллекция по умолчанию
Создать новую
Smartphone and Tablet pc with financial charts and graphs on office desk, business concept
Коллекция по умолчанию
Коллекция по умолчанию
Создать новую
Efficient Office Productivity: Augmented Reality View of Smart Phone Displaying Charts and Reports on Work Desk
Коллекция по умолчанию
Коллекция по умолчанию
Создать новую

reports and histograms on paper on the table, analytics and statistics on paper, business analytics
Коллекция по умолчанию
Коллекция по умолчанию
Создать новую
A collection of pie charts and a central bar graph illustrate key business metrics and financial performance.
Коллекция по умолчанию
Коллекция по умолчанию
Создать новую
Analytics infographics elements. Data graphic, marketing chart diagram. Budget flat histogram. Statistic infographics elements. Illustration of visualization diagram, infographic statistic flowchart
Коллекция по умолчанию
Коллекция по умолчанию
Создать новую
Highly rendering of paper charts and graphs on the wall. Business concept
Коллекция по умолчанию
Коллекция по умолчанию
Создать новую
People take view business growth graphs
Коллекция по умолчанию
Коллекция по умолчанию
Создать новую
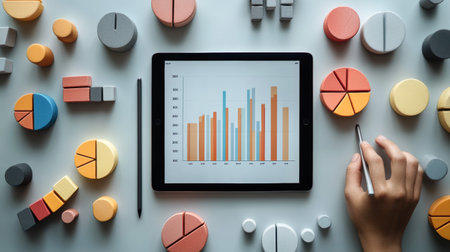
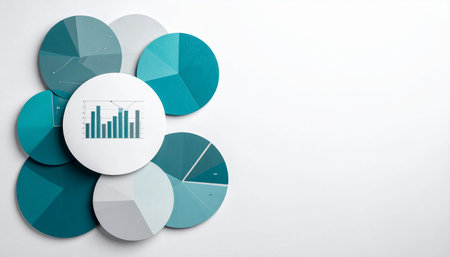
Digital tablet displaying bar charts surrounded by colorful 3D pie charts and blocks. Represents data analysis, business insights, and analytics
Коллекция по умолчанию
Коллекция по умолчанию
Создать новую
A colorful bar chart representing stock performance over time, with various heights and vibrant colors, set against a clean, professional backdrop.
Коллекция по умолчанию
Коллекция по умолчанию
Создать новую
Man showing business graph on wooden table
Коллекция по умолчанию
Коллекция по умолчанию
Создать новую
Graph charts business collection of glowing colorful diagrams, vector illustrations set for infographic. Infocharts, bars, pie statistics.
Коллекция по умолчанию
Коллекция по умолчанию
Создать новую
Data financial instruments chart, downtrend stock market analysis report
Коллекция по умолчанию
Коллекция по умолчанию
Создать новую
Digitally generated image of financial charts and graphs against black background
Коллекция по умолчанию
Коллекция по умолчанию
Создать новую
Development and growth concept. Businessman plan growth and increase of positive indicators in his business.
Коллекция по умолчанию
Коллекция по умолчанию
Создать новую
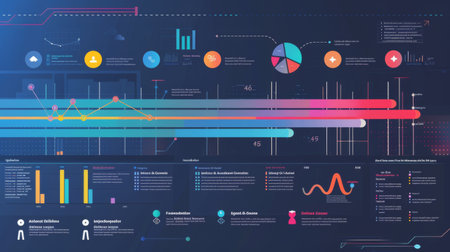
Stunning futuristic data visualization screens featuring vibrant colors and dynamic gradients set against a dark background ideal for business analysis and presentations.
Коллекция по умолчанию
Коллекция по умолчанию
Создать новую
A financial bar chart showing comparison of investment returns, with green bars rising sharply to symbolize growth, displayed against a white background with grid lines.
Коллекция по умолчанию
Коллекция по умолчанию
Создать новую
A business presentation slide featuring an infographic on consumer behavior trends and market analysis.
Коллекция по умолчанию
Коллекция по умолчанию
Создать новую

Image of data processing over diverse schoolchildren having image call. Global education and digital interface concept digitally generated image.
Коллекция по умолчанию
Коллекция по умолчанию
Создать новую
4 photos, Set of different line charts and icons in unique style. Ideal for data visualization and presentations. Icons can be easily customized and integrated into various design projects.
Коллекция по умолчанию
Коллекция по умолчанию
Создать новую
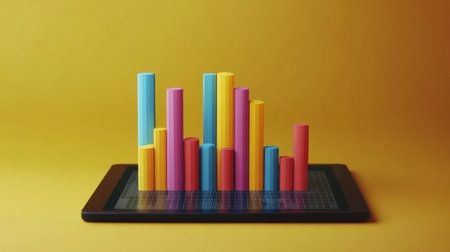
A vibrant 3D bar graph displayed on a tablet against a bright yellow background, illustrating data analysis and modern business growth concepts.
Коллекция по умолчанию
Коллекция по умолчанию
Создать новую
Vibrant bar graph displayed on a digital screen, showcasing data insights and trends for business analysis. Ideal for presentations and reports.
Коллекция по умолчанию
Коллекция по умолчанию
Создать новую
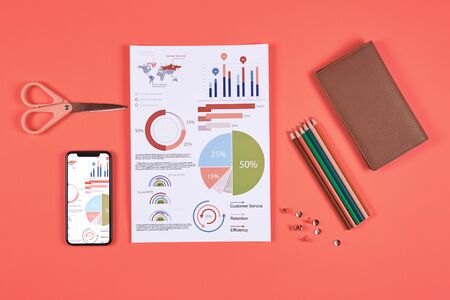
Above view flat lay of business data charts and office supplies over coral background, copy space
Коллекция по умолчанию
Коллекция по умолчанию
Создать новую
course infographic table of contents
Коллекция по умолчанию
Коллекция по умолчанию
Создать новую
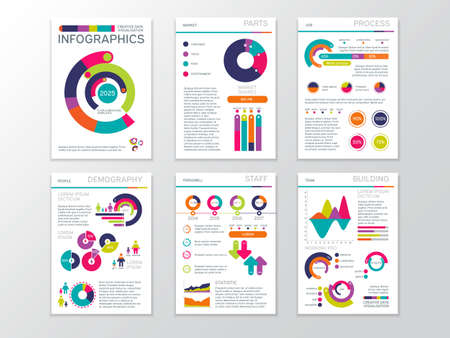
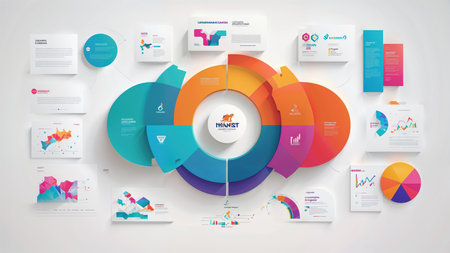
Modern business presentation documents with graphics and infographic charts. Corporate marketing vector template brochure pages. Documents with color graphic for presentation illustration
Коллекция по умолчанию
Коллекция по умолчанию
Создать новую
This image presents various infographic charts and graphs for data representation. The composition features a clean, white background, with a bright color palette. Suitable for illustrating complex data, it could be used in presentations, reports, or marketing materials to convey information effectively in a visually engaging way.
Коллекция по умолчанию
Коллекция по умолчанию
Создать новую

Bright turquoise background with colorful business charts, graphs, and infographics ideal for presentations and marketing analyses in professional environments.
Коллекция по умолчанию
Коллекция по умолчанию
Создать новую

Business finance person is reviewing a company's financial documents prepared by the Finance Department for a meeting with business partners. Concept of validating the accuracy of financial numbers.
Коллекция по умолчанию
Коллекция по умолчанию
Создать новую
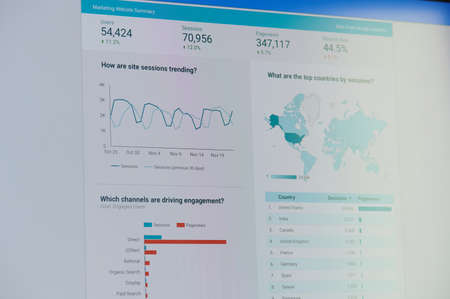
New york, USA - November 24, 2020: Google ads marketing website summarydashboard on laptop screen
Коллекция по умолчанию
Коллекция по умолчанию
Создать новую
Business data market elements. Pie, Line, Candlestick Chart. Charts and graphs. Planning and visualization of statistics. Isolated Design in 2d flat cartoon style for web, social media, print
Коллекция по умолчанию
Коллекция по умолчанию
Создать новую
A vibrant business infographic with various graphs and data points, clearly presenting statistical information.
Коллекция по умолчанию
Коллекция по умолчанию
Создать новую
A comprehensive set of hand-drawn and digital icons, charts, graphs, and world maps representing business concepts and data analysis.
Коллекция по умолчанию
Коллекция по умолчанию
Создать новую
Marketing Analysis Charts, Graphs, and Data Visualization on a Wall, Business Concept
Коллекция по умолчанию
Коллекция по умолчанию
Создать новую
Business performance analysis. Business Graphs with Keyboard, pen.
Коллекция по умолчанию
Коллекция по умолчанию
Создать новую
graph chart of stock market investment trading.
Коллекция по умолчанию
Коллекция по умолчанию
Создать новую
A colorful chart rests on a wooden table surrounded by various documents, showcasing a creative workspace with artistic and analytical elements.
Коллекция по умолчанию
Коллекция по умолчанию
Создать новую
Our profits are on the rise. Shot of paperwork and stationery on a desk in an empty office during the day.
Коллекция по умолчанию
Коллекция по умолчанию
Создать новую
Charts Graphs spreadsheet paper. Financial development, Banking Account, Statistics, Investment Analytic research data economy, Stock exchange Business office company meeting concept.
Коллекция по умолчанию
Коллекция по умолчанию
Создать новую
Office workplace table with report pages with financial data
Коллекция по умолчанию
Коллекция по умолчанию
Создать новую

Office desk table with laptop, supplies and financial reports. Top view with copy space
Коллекция по умолчанию
Коллекция по умолчанию
Создать новую
Charts and graphs on A4 page view from above
Коллекция по умолчанию
Коллекция по умолчанию
Создать новую
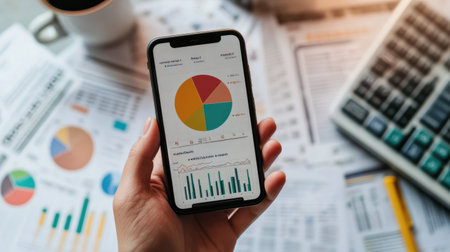
Hand holding a smartphone displaying a pie chart of budget allocation, with a background of financial papers and a coffee cup
Коллекция по умолчанию
Коллекция по умолчанию
Создать новую
A professional workspace showcasing a business report with colorful charts and graphs on a wooden table, accompanied by a laptop and stationery.
Коллекция по умолчанию
Коллекция по умолчанию
Создать новую

Image of data processing over landscape. Global digital interface technology and connections concept digitally generated image.
Коллекция по умолчанию
Коллекция по умолчанию
Создать новую
Graph shows donations to childhood cancer foundations and their impact on funding and support for families and research.
Коллекция по умолчанию
Коллекция по умолчанию
Создать новую
Financial paper with charts and diagrams on gray table
Коллекция по умолчанию
Коллекция по умолчанию
Создать новую

Colorful financial bar chart demonstrating growth and upward trend. Business development progress, data visualization for market analysis.
Коллекция по умолчанию
Коллекция по умолчанию
Создать новую
Graphs and charts on paper showing financial planning.
Коллекция по умолчанию
Коллекция по умолчанию
Создать новую
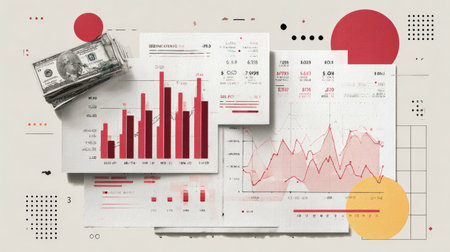
This image showcases financial analytics with various graphs and charts alongside dollar bills, capturing the essence of investment and economic trends in a stylish design.
Коллекция по умолчанию
Коллекция по умолчанию
Создать новую
Engaging data visualization featuring various graphs and infographics that depict crucial business metrics and statistical analysis for effective insights.
Коллекция по умолчанию
Коллекция по умолчанию
Создать новую
Legion-Media
Создайте свои проекты на основе качественных стоковых фотографий и видео.


Copyright © Legion-Media.